Slight decline in tax burden of Swiss cantons and municipalities
The 2021 exploitation index calculated by the Federal Finance Administration shows a decline in two thirds of the countries, with Bern being the largest
The 2021 utilisation index calculated by the Federal Finance Administration has fallen in two-thirds of the countries, the largest in Berne.
On average in Switzerland, taxes burden about a quarter of the resource potential of local public authorities. And overall the differences in tax burden between the cantons have changed little.
In two-thirds of the states of the Swiss Confederation the tax burden has fallen since the last reference year. This is shown by the Exploitation Index, which was compiled for 2021 by the Federal Finance Administration (FFA).
The index shows to what extent taxpayers are burdened on average by cantonal and communal taxes. On average in Switzerland, 24.7% of the resource potential of these public bodies is subject to taxation.
This value results from the sum of the tax levies of the municipalities and cantons divided by the resource potential of Switzerland as a whole. This unit of magnitude reflects the potential of taxpayers and thus the economic capacity of the cantons.

In the capital city there is the greatest reduction
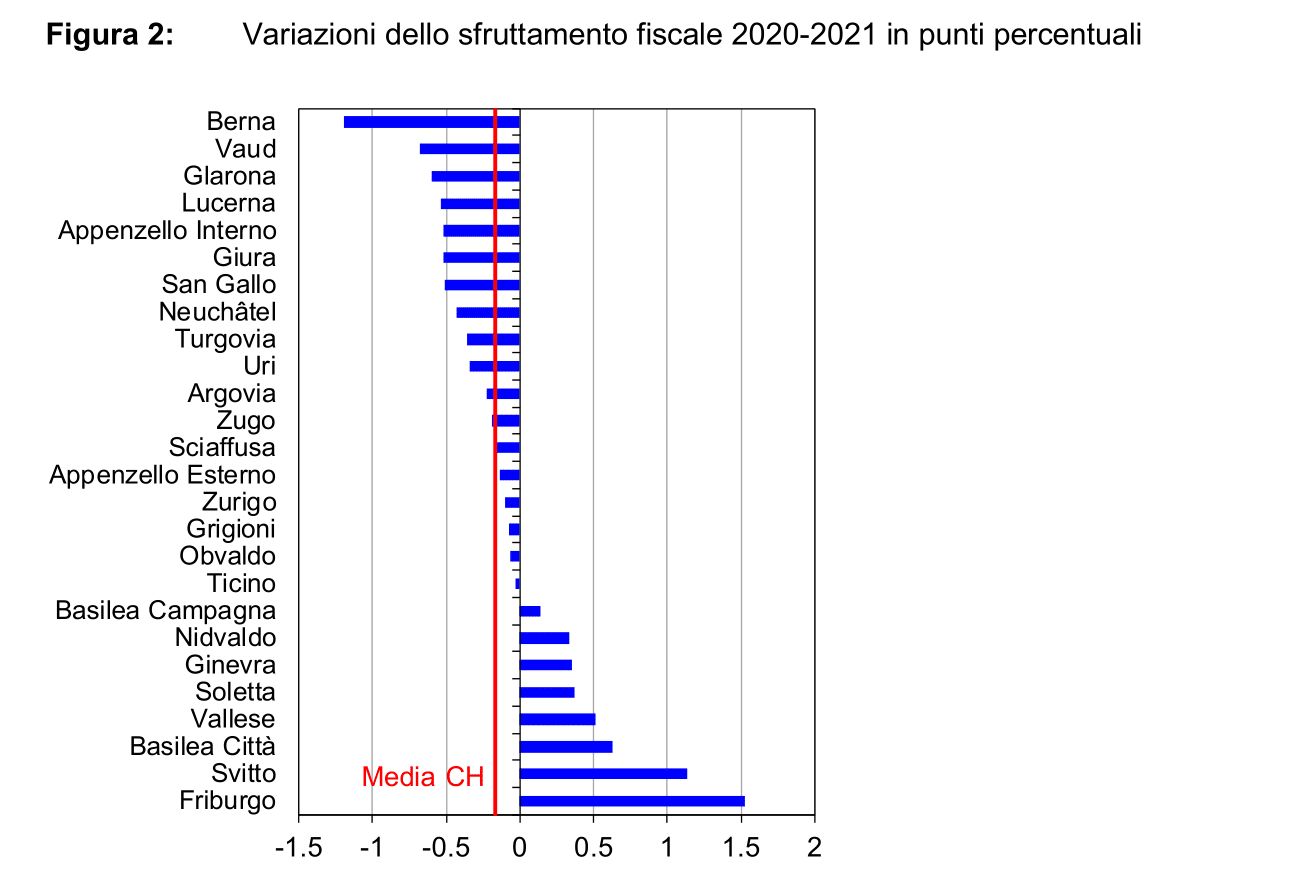
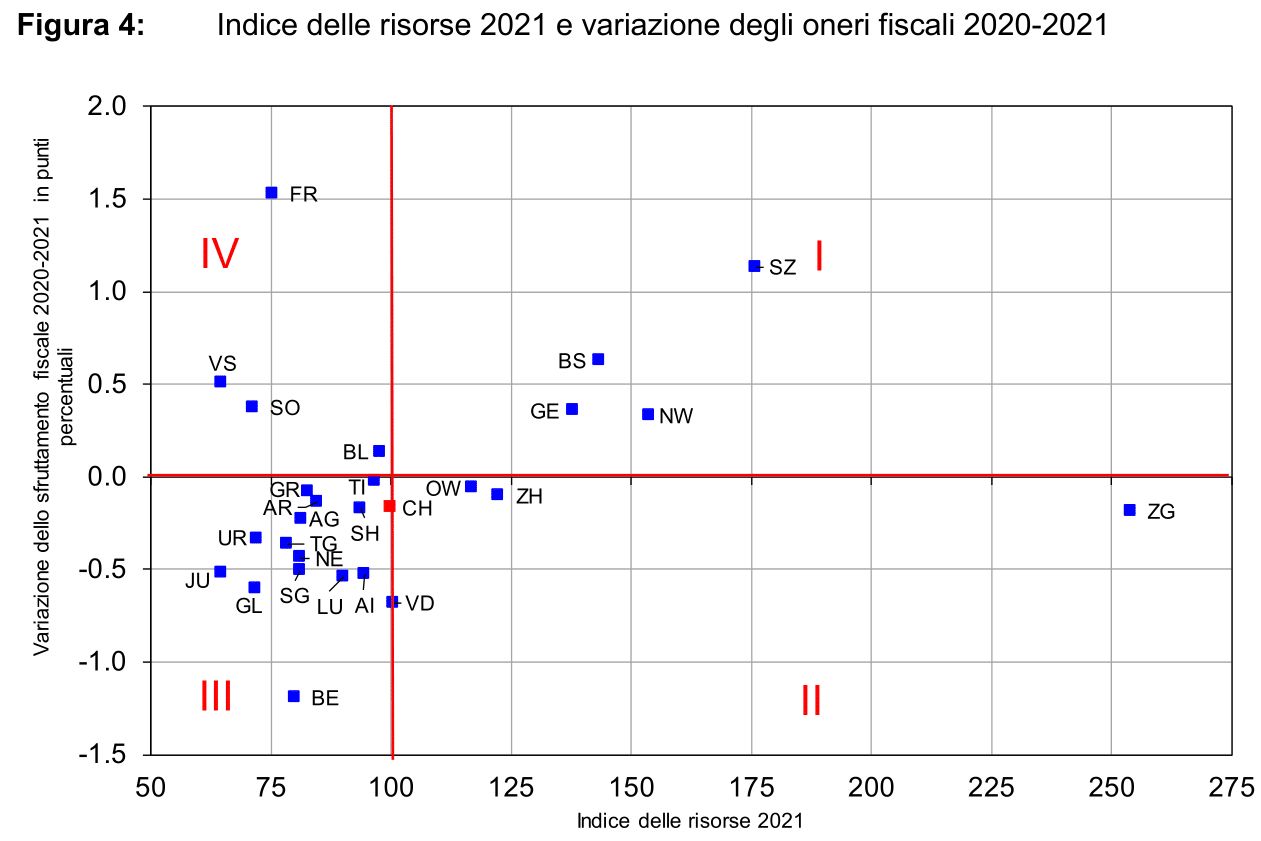
In 17 cantons, tax revenue utilization has decreased. However, compared to previous years, the decrease is small in many areas. The biggest decrease is in the Canton of Bern.
Eight cantons recorded an increase, in particular Fribourg and Schwyz. If Switzerland as a whole is considered, however, tax exploitation has decreased slightly compared to the last reporting year (in 2020, it was 24.9 percent).
In general, the cantonal ranking has changed little. Especially at the bottom and at the top of the ranking, the order has remained almost identical.

Nidwalden, Schwyz and Zug below average
In Central Switzerland, the cantons of Nidwalden, Schwyz and Zug are still clearly below the national average, with the canton bordering the Zugersee having the lowest value (11%).
In some cantons in Western Switzerland and in Basel-Stadt the tax burden is above average, while Geneva remains the canton with the highest tax burden (34.1%).
Only a few changes are also observed in the middle part of the ranking. Looking at the entire ranking, the shifts mainly concern two cantons: while Bern gains two positions, Fribourg loses three.

What is the Tax Exploitation Index?
The tax exploitation index should be interpreted in the same way as the tax rate, which is calculated at national level in Switzerland. Unlike the tax rate, taxes are not compared with the Gross Domestic Product (GDP) but with the resource potential according to the national fiscal equalization.
The index, which has been published since 2009, represents the overall tax burden in a canton and shows to what extent taxpayers are burdened overall by the tax revenues of states and municipalities.
However, it does not allow conclusions to be drawn on tax rates and tax rates, since differences in utilization may also be due to the fact that the share of individual tax types may vary from one canton to another.

Equalization and financial statistics
However, the Federal Finance Administration relies on figures from fiscal equalisation and economic statistics to calculate the index.
The 2021 tax exploitation index, as calculated by the FFA, thus expresses the ratio between the tax revenues of the cantons and municipalities (calculated as the average value of the actual tax revenues of the years 2015-2017) and the resource potential for the reference year 2021 (also calculated as the average value of the tax calculation years 2015-2017).
The resource potential is determined on the basis of the financial equalization figures and reflects the economic potential of the taxpayers and, consequently, the economic strength of the cantons.


