
Up the income of Swiss households, but…
Bank Cler’s “Swiss Income Monitor” analysis finds increases of CHF 3,500 and CHF 5,400 on median and average earnings, alongside greater inequalities…
Bank Cler’s “Swiss Income Monitor” creates more transparency on the development and distribution of wages and incomes in Switzerland.
Did earnings increase between 2007 and 2017? Are there regional differences? How do they manifest themselves? How many millionaires are there in the Swiss Confederation?
In addition to providing answers to these questions, the analysis takes a look at the consequences of the coronavirus pandemic.
For the period 2020-2021 it is already clear that the crisis will have a negative impact on the distribution of income.
An analysis on FTA data from 2007 to 2017.
Here is a summary of the key findings from Cler Bank’s “Swiss Income Monitor”.
The data base, obtained from the Federal Tax Administration (FTA), is net income per household at the Swiss and cantonal level for the years 2007 to 2017;
incomes in the Swiss Confederation increased by an average of CHF 3,500 over the period examined;
the Swiss household earns an average of 8.6 percent more;
the Canton of Zug has the highest average income (CHF 107,000);
Jura (CHF 53,100) and Valais (CHF 50,600) have the lowest incomes;
between 2007 and 2017, the number of millionaires (wealth) increased to a remarkable 52 percent, exceeding 330,000;
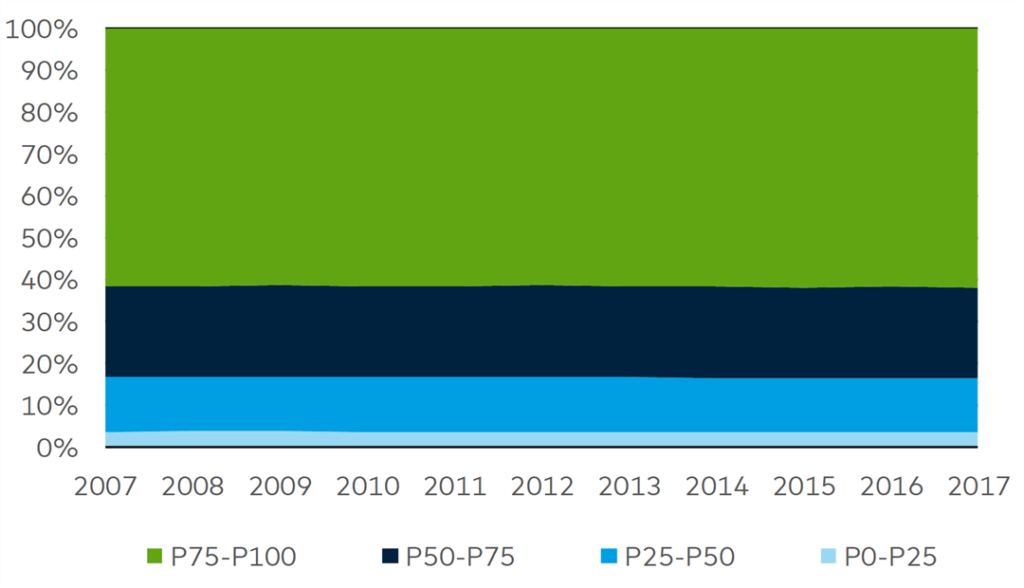
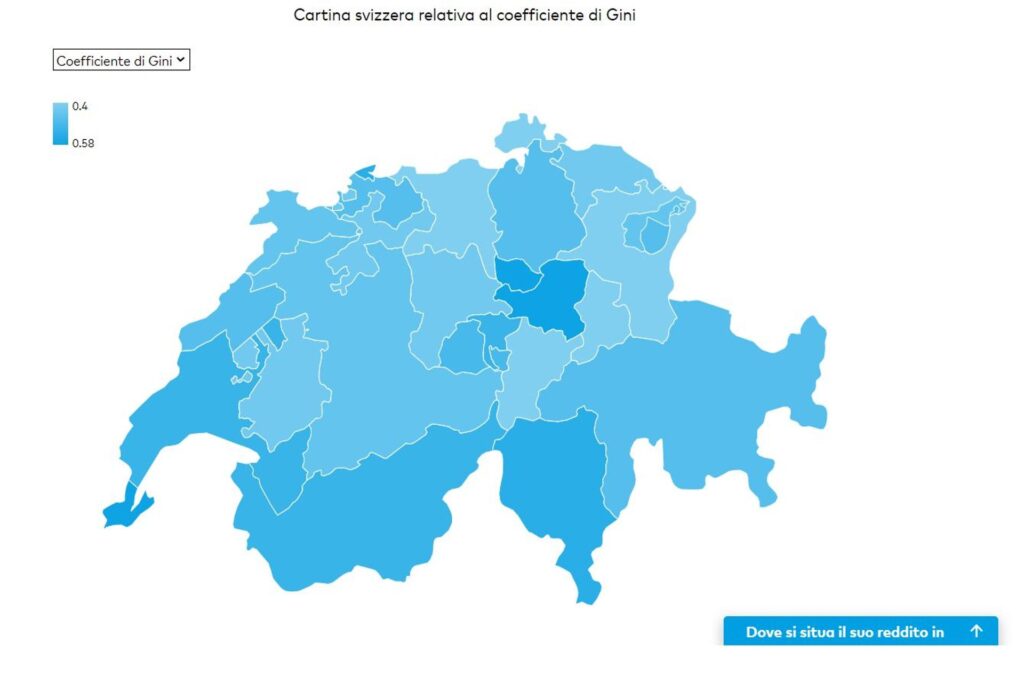
overall, inequality in the income distribution increased slightly.
Focus on household growth
Together with the Swiss economic research institute BAK Economics, Cler Bank analyzed the distribution of income in Switzerland and the various cantons for the years 2007 to 2017.
The data for 2017 are the most up-to-date data made available by the Federal Tax Administration.
The analysis is based on the net income of the entire household: this means that, in the case of households with two incomes, the sum of the money earned is considered.
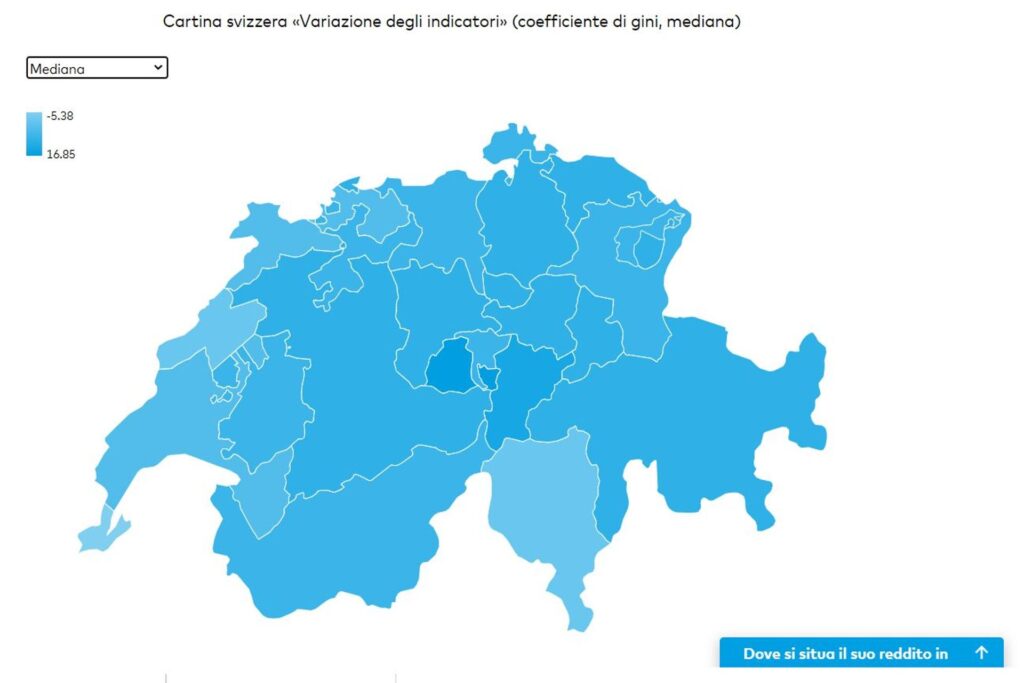
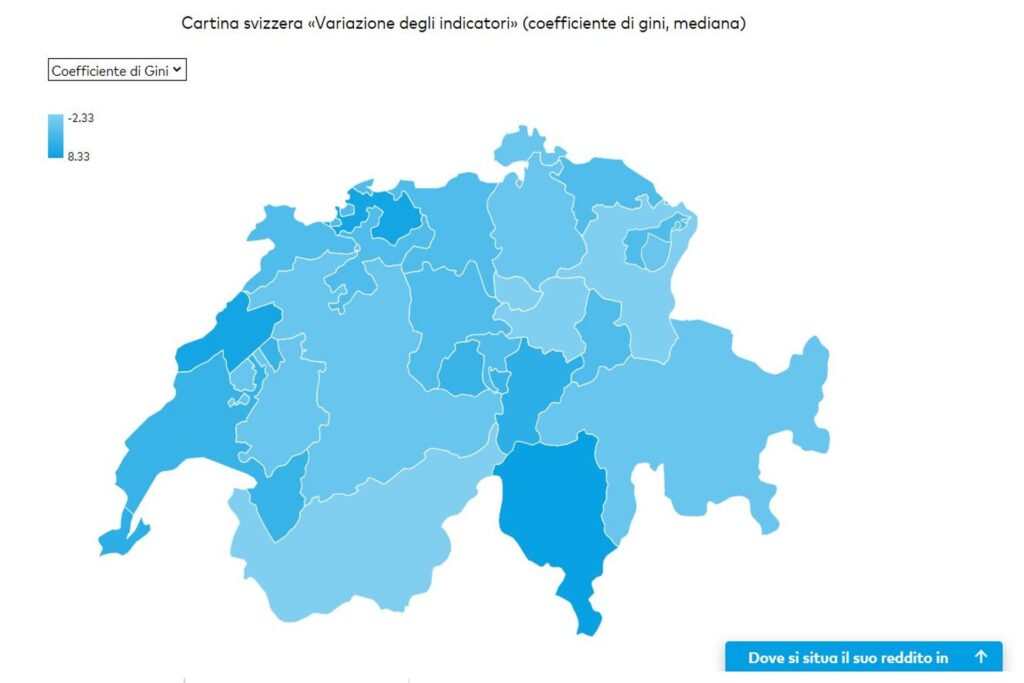
For Mats Bachmann, head of the CEO Office at Bank Cler, the results should not be read only in a positive light: “In Switzerland, income rose significantly between 2007 and 2017. This applies to both average income (8.6 percent) and median income (7.1 percent). However, overall inequality in the income distribution has grown over time, so the gap between rich and poor has widened slightly.”
Taxation, sixteen fields of action for the Switzerland of the future
A group of experts will improve Switzerland as a tax centre
The difference between what you give and what you receive is the residual tax burden.
For Martin Eichler, chief economist at BAK, the coronavirus crisis is likely to increase inequality even more: “The effects of the coronavirus pandemic on the economy and society are not typical of a crisis and affect almost all areas of life. However, the impact is proportionately large for incomes located at the bottom of the distribution curve and therefore inequality will increase.”
7.1 percent increase in median earnings
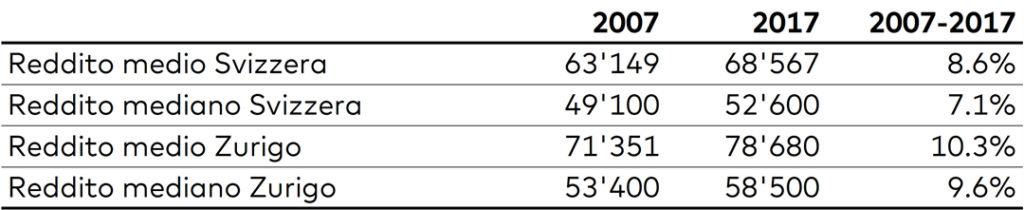
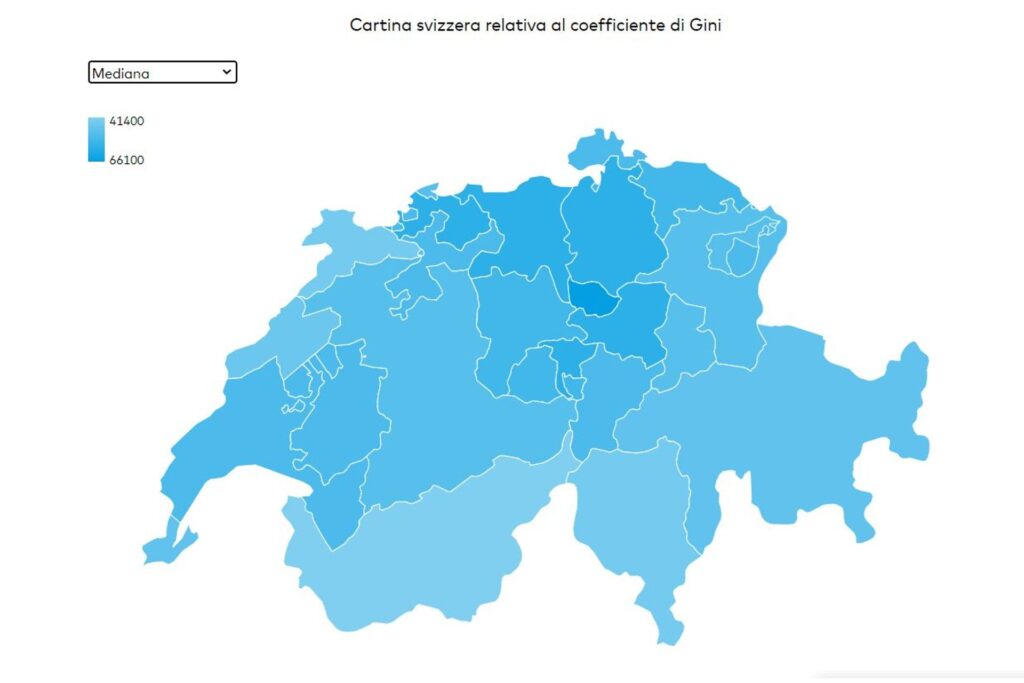
Over the period under review, from 2007 to 2017, the median net income (median) of Swiss households rose by 7.1 percent (+0.7 percent), an increase of CHF 3,500, and at the end of 2017 amounted to about CHF 52,600.
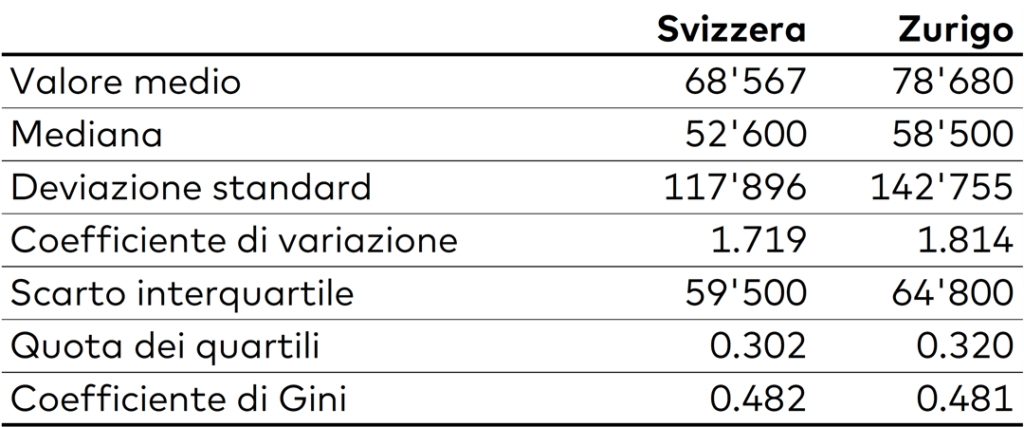
The highest median net income is in the tax-advantaged canton of Zug, where it amounts to CHF 66,100, followed by the cantons of Basel-Landschaft (CHF 59,200) and Zurich (CHF 58,500).
The lowest median net incomes are found in Ticino (44,500 CHF) and Valais (41,400 CHF).
On average net income of almost 5,400 CHF
How much does an average Swiss household actually “earn”? In 2017 about 68,500 CHF. Compared to the median net income, higher incomes have a greater influence on the average value.
In the calculation of the average, the income is almost 16,000 CHF higher. Between 2007 and 2017, the average net income increased by almost 5,400 CHF, which corresponds to an overall increase of 8.6%.
When looking at individual years, however, the impact of the financial crisis only caused a weakening of the growth momentum in 2009 and 2010.
In fact, Swiss average income increased in all years except 2012 and 2015.
The highest profits are in the canton of Zug
In which cantons are residents well positioned financially? And in which do they have to make do with less?
When looking at individual cantons, tax-friendly ones such as Zug, Schwyz and Nidwalden top the list of areas with the highest average incomes.
Zug has the highest average cantonal income (107,000 CHF), exceeding the national average by around 39,000 CHF, but it is also the only canton with an average income above the symbolic threshold of 100,000 CHF.
Jura and Valais are the two worst performers.
They are followed closely by the cantons of Schwyz (CHF 96,700), Nidwalden (CHF 83,800), Zurich (CHF 78,700) and Basel-Landschaft (CHF 77,300), although Zurich and Basel-Landschaft are not among the most tax-friendly cantons.
Jura and Valais close the ranking with an average income of CHF 53,100 and CHF 50,600 respectively.
330,000 millionaires in the federal government
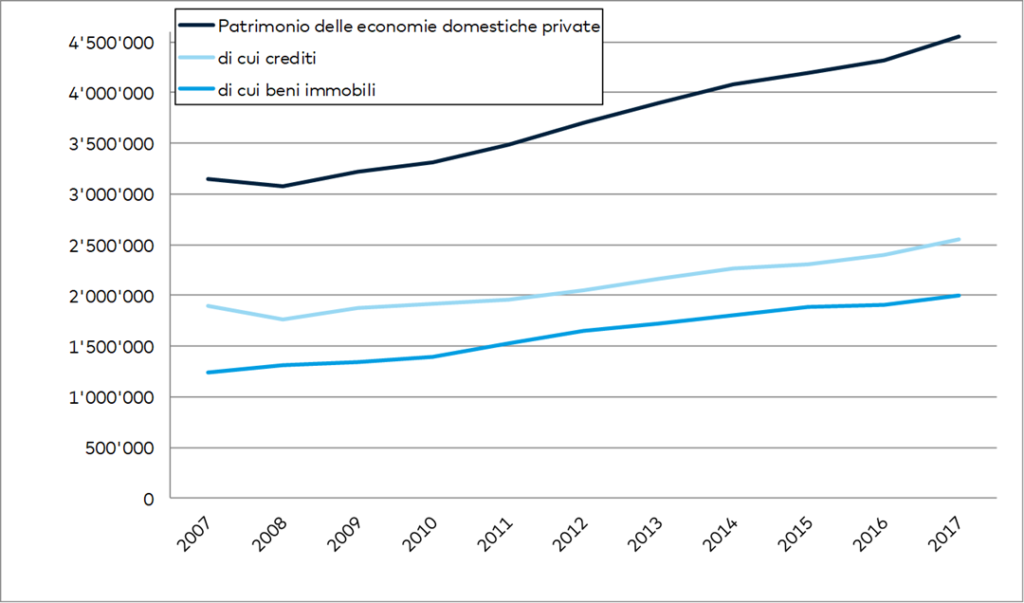
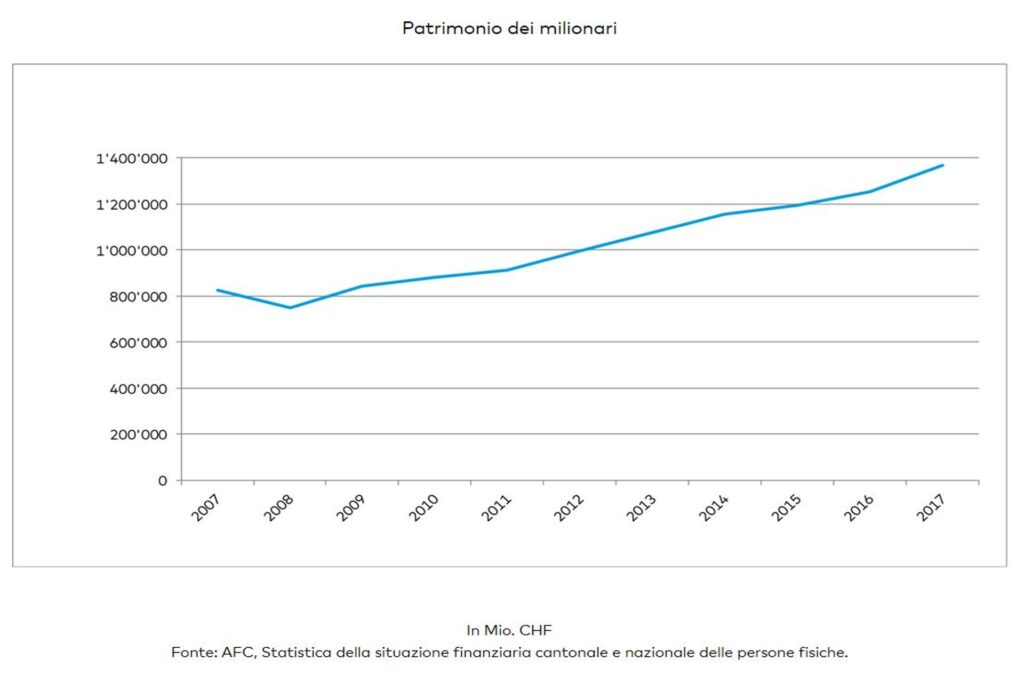
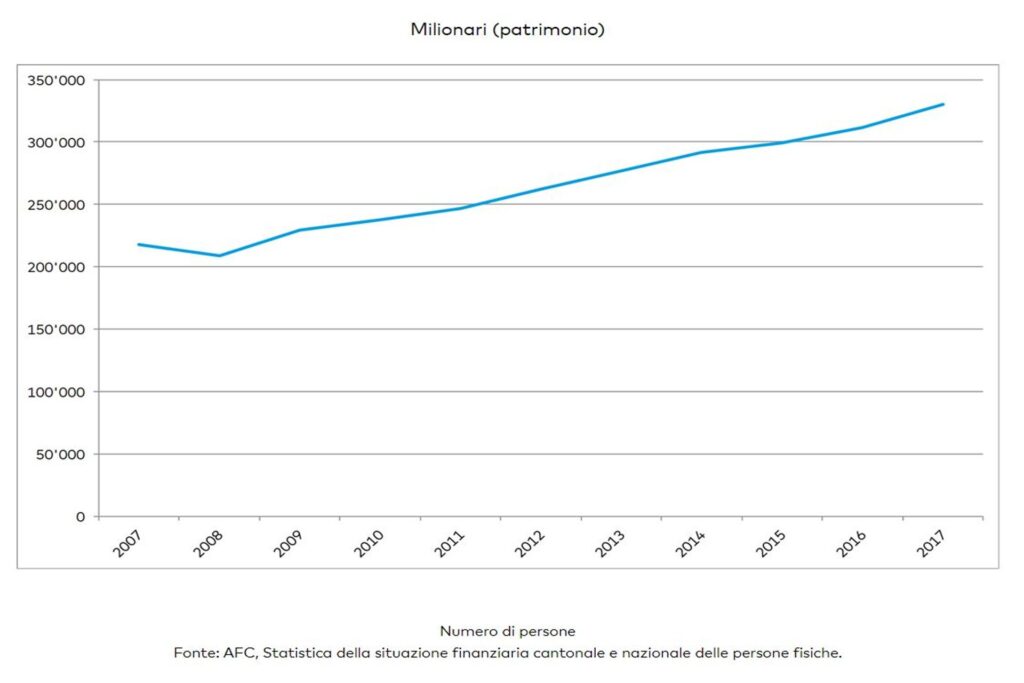
Between 2007 and 2017, the number of millionaires (in terms of assets) increased to a remarkable 52 percent, exceeding 330,000.
This increase can be explained neither by inflation (which was practically zero) nor by migration, but is instead mainly due, in addition to the positive income trend, to the development of securities and real estate prices.
The stock market crash caused by the 2008 financial crisis is also noticeable in this way.
Since then, however, the number of millionaires (assets) has been steadily increasing.

Coronavirus shingle on 2020-2021 biennium
The development up to 2017 is known, but what is happening now?
At the beginning of 2021 we are still in the midst of a crisis.
What effect does the coronavirus pandemic have on income distribution in Switzerland?
Will this crisis, as is often the case, also help to reduce income inequality?
Up to 6 billion from the National Bank for Switzerland and the cantons
Digital tax return in Appenzell Ausserrhoden
Swiss SMEs saved more than 2 billion on duties
The opinion of Martin Eichler, chief economist at BAK Economics: “Let’s say right away that this is an ‘atypical’ crisis, at least in terms of its impact on income distribution. In fact, income inequality will increase further as a result of the coronavirus pandemic. Below-average incomes will have to take further losses.”